Fig. 20
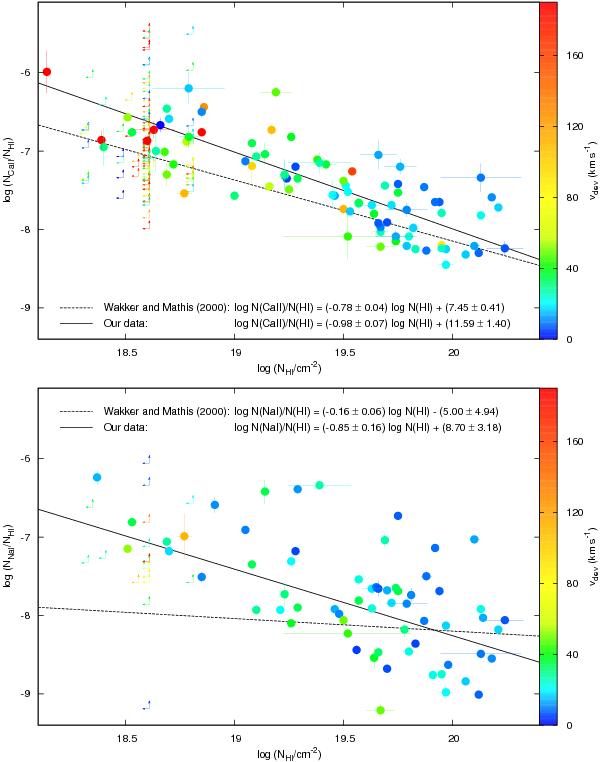
Ca ii/H i and Na i/H i ratios calculated for our sample. Arrows show lower limits (associated with H i non-detections). The colour of the data points marks their deviation velocity. The solid black line shows the best linear fit to the data, for comparison we have also plotted the relations found by Wakker & Mathis (2000, dashed line).
Current usage metrics show cumulative count of Article Views (full-text article views including HTML views, PDF and ePub downloads, according to the available data) and Abstracts Views on Vision4Press platform.
Data correspond to usage on the plateform after 2015. The current usage metrics is available 48-96 hours after online publication and is updated daily on week days.
Initial download of the metrics may take a while.