Fig. 19
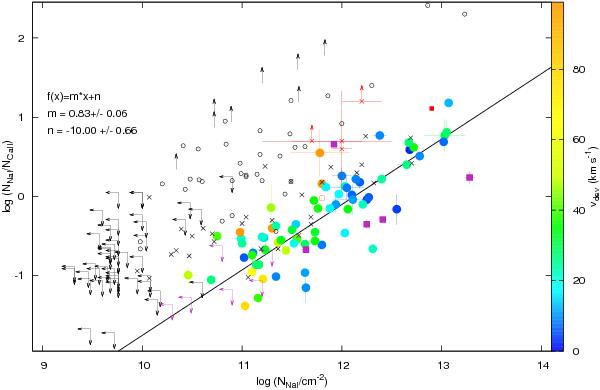
Na i/Ca ii ratios as a function of log NNa i. The red symbols show the DLA data (1.06 ≤ z ≤ 1.18) of Kondo et al. (2006, see their Fig. 5 for a detailed explanation of the different symbols). Black circles and crosses show the data for the Ca ii and Na i absorbers in Milky Way (Vallerga et al. 1993) and in the LMC (Vladilo et al. 1993), respectively. Purple symbols show higher-redshift absorption lines extracted from our sample (Richter et al. 2011). Filled circles show the ratios found in our MW halo sample, with deviation velocities colour-coded. The black solid line represents a power-law fit with slope β = 0.8 ± 0.1.
Current usage metrics show cumulative count of Article Views (full-text article views including HTML views, PDF and ePub downloads, according to the available data) and Abstracts Views on Vision4Press platform.
Data correspond to usage on the plateform after 2015. The current usage metrics is available 48-96 hours after online publication and is updated daily on week days.
Initial download of the metrics may take a while.