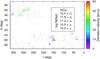
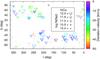
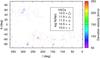
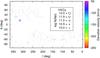
Fig. 12
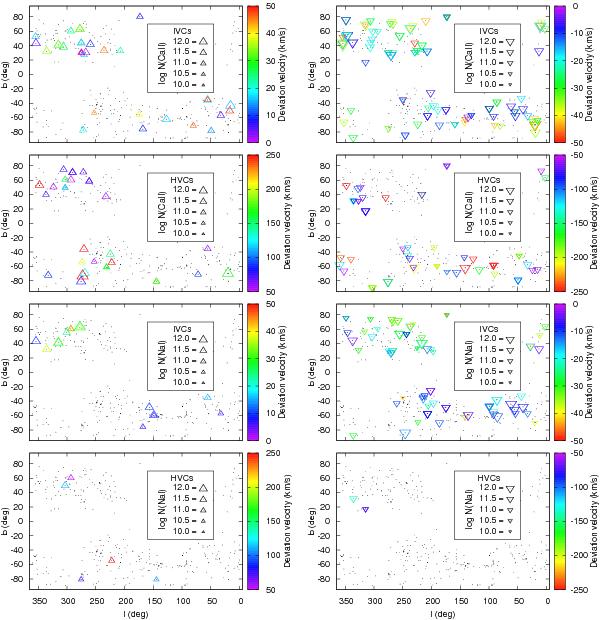
Distribution of deviation velocities of the observed intermediate- and high-velocity Ca ii and Na i absorbers versus Galactic longitude and latitude. The dimensions of the triangles are proportional to the logarithm of the Ca ii and Na i column densities observed with the UVES instrument. The black dots mark the position of all sight lines for which spectra were available.

Current usage metrics show cumulative count of Article Views (full-text article views including HTML views, PDF and ePub downloads, according to the available data) and Abstracts Views on Vision4Press platform.
Data correspond to usage on the plateform after 2015. The current usage metrics is available 48-96 hours after online publication and is updated daily on week days.
Initial download of the metrics may take a while.