Fig. 11
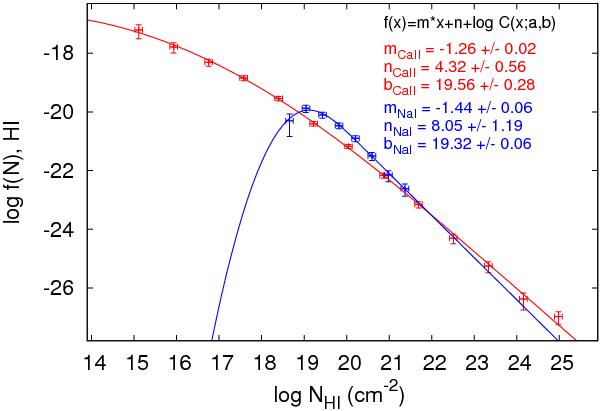
Converted H i column density distribution functions f(N). The H i column densities were calculated from the Ca ii and Na i column densities using the correlation found by Wakker & Mathis (2000). The solid lines represent power-law fits (again corrected for completeness of the sample), with a slope of βH i [Ca ii] = −1.26 ± 0.02 and βH i [Na i] = −1.44 ± 0.06.
Current usage metrics show cumulative count of Article Views (full-text article views including HTML views, PDF and ePub downloads, according to the available data) and Abstracts Views on Vision4Press platform.
Data correspond to usage on the plateform after 2015. The current usage metrics is available 48-96 hours after online publication and is updated daily on week days.
Initial download of the metrics may take a while.