Fig. 6
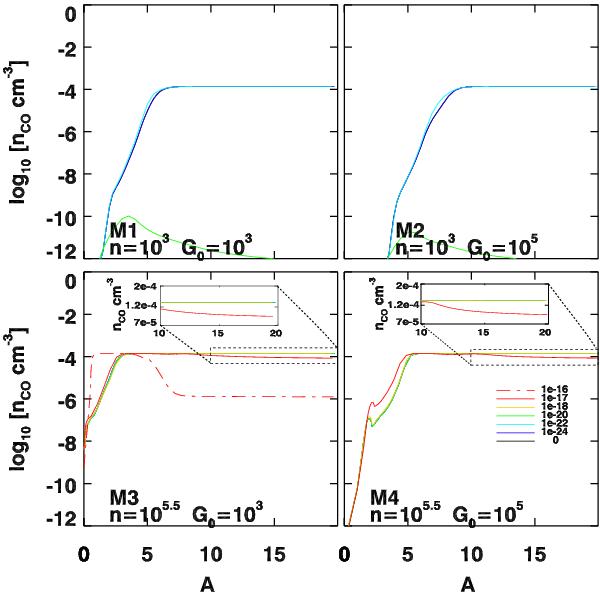
CO abundance as a function of AV for selected models. In all the diagrams, the C/CO transition zone is shifted towards the surface as a function of increasing Γmech. For M1 and M2, the abundance of CO is below the displayed range for Γmech > 10-20 erg cm-3 s-1 (these curves are not shown). The other curves almost overlap except for Γmech = 10-20 erg cm-3 s-1. In models M3 and M4 the abundance of CO drops slightly beyond the transition zone compared to the case of no mechanical heating. The curves overlap except for Γmech = 10-16 erg cm-3 s-1 where the C+/C/CO transition does not fully take place.
Current usage metrics show cumulative count of Article Views (full-text article views including HTML views, PDF and ePub downloads, according to the available data) and Abstracts Views on Vision4Press platform.
Data correspond to usage on the plateform after 2015. The current usage metrics is available 48-96 hours after online publication and is updated daily on week days.
Initial download of the metrics may take a while.