Fig. 3
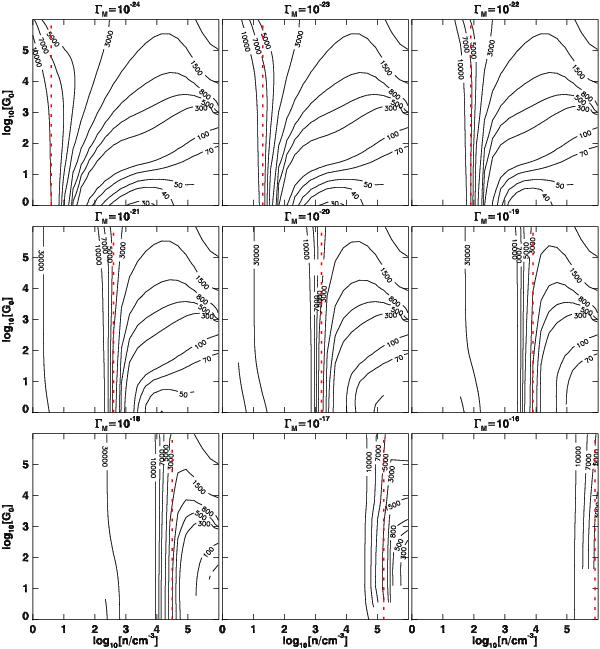
Surface temperature (for Z = Z⊙) for different values of mechanical heating. Each panel shows the surface temperature contours for a different value of Γmech mentioned at the top of each panel. In probing the effect of mechanical heating, each panel should be compared to the middle panel of Fig. 1 which is also for Z = Z⊙. Different parts of the parameter space in n and G0 are affected differently, depending mainly on the gas density. For Γmech < 10-21 erg cm-3 s-1, regions in density with n < 103 cm-3 have their temperatures increase significantly. The vertical dashed red lines mark densities n = nc where Γmech = Γtotal,surface. The location of these lines moves from very low densities (n ~ 100.5 cm-3) to very high densities (n > 105 cm-3) as Γmech increases from 10-24 to 10-16 erg cm-3 s-1, sweeping the parameter space in density (for a certain grid) from left to right. In general the contour lines at n = nc become vertical, indicating that the surface temperature becomes independent of G0. In subsequent plot, those lines are plotted only for Z = Z⊙ grids, since the fits from which n = nc were derived were done only for solar metallicity.
Current usage metrics show cumulative count of Article Views (full-text article views including HTML views, PDF and ePub downloads, according to the available data) and Abstracts Views on Vision4Press platform.
Data correspond to usage on the plateform after 2015. The current usage metrics is available 48-96 hours after online publication and is updated daily on week days.
Initial download of the metrics may take a while.