Fig. 1
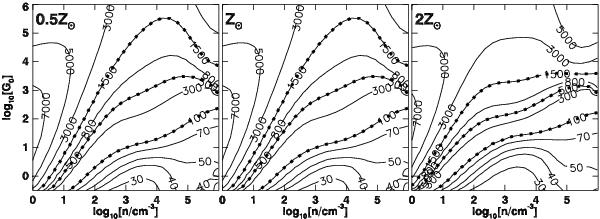
Temperature profile (without mechanical heating) at the cloud surface for different metallicities. Generally, the temperature rises as a function of G0 and constant n, since the dominant heating term is the photo-electric heating, which is proportional to G0. However the behavior for constant G0 as a function of n is not as trivial. See Sect. 3.1 of Kaufman et al. (1999) and Sect. 3 of Meijerink et al. (2007) for more discussion of the topology of the contours. This version of the code covers a larger parameter range than Meijerink et al. (2007). Solid lines with filled squares highlight the temperature contours for 100, 500 and 1500 K. The most significant change when comparing the three panels is for the 1500 K contour, where for Z = 2 Z⊙ higher temperatures are attained (compared to the lower metallicities) in the same part of the parameter space (n > 103 cm-3, G0 > 104).
Current usage metrics show cumulative count of Article Views (full-text article views including HTML views, PDF and ePub downloads, according to the available data) and Abstracts Views on Vision4Press platform.
Data correspond to usage on the plateform after 2015. The current usage metrics is available 48-96 hours after online publication and is updated daily on week days.
Initial download of the metrics may take a while.