Fig. 1
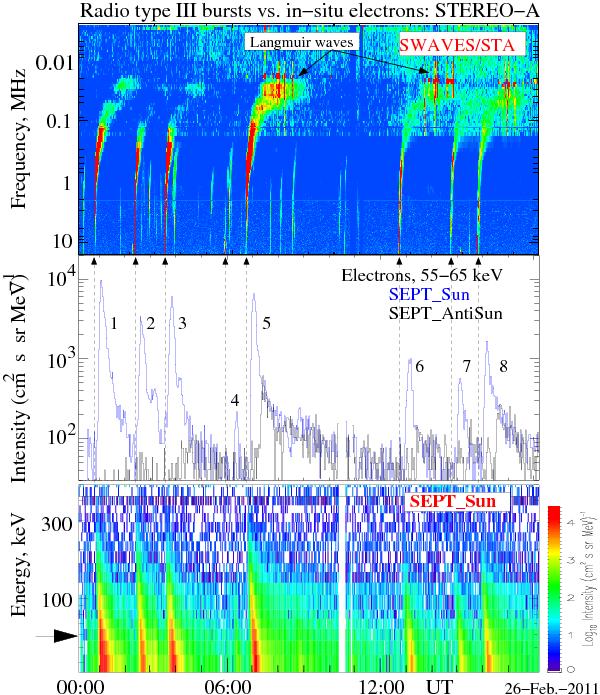
Events on 26 February 2011: a sequence of type III bursts and electron spike events. Top: dynamic radio spectrum of type III bursts (SWAVES/STA). Middle: time profiles of electron spikes intensities in the energy range 55–65 keV measured with telescopes looking towards the Sun (SEPT_Sun, blue line) and in the anti-Sun directions (SEPT_AntiSun). The vertical lines indicate the onset of type IIIs relative to in-situ electron spikes. The numbers indicate the consecutive spikes. Bottom: dynamic energy spectrum of electrons in the energy range 35–500 keV. The time profiles of electrons and the energy spectrum is shifted by 13 min (middle and bottom panels) to take into account the the difference between the propagation time of electrons and type III radio emission. The arrow on the left indicates the 55–65 keV energy channel.
Current usage metrics show cumulative count of Article Views (full-text article views including HTML views, PDF and ePub downloads, according to the available data) and Abstracts Views on Vision4Press platform.
Data correspond to usage on the plateform after 2015. The current usage metrics is available 48-96 hours after online publication and is updated daily on week days.
Initial download of the metrics may take a while.