Fig. 2
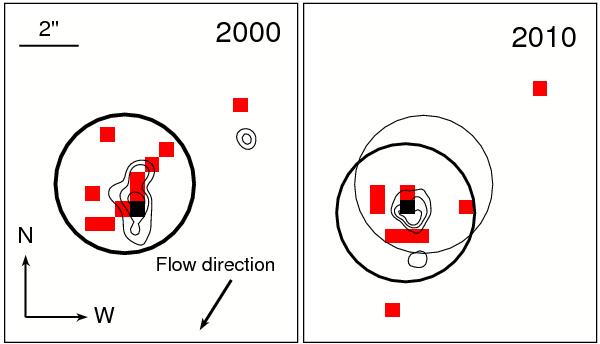
Proper-motion of the X-ray emitting plasma. Red squares denote pixel with single photon events and black squares display double photon events. Left: X-ray emission (0.3−1.0 keV) from 2000 with Hα contours from 1997 in black. Right: X-ray emission from 2010 with Hα contours from 2008. The thick circles of radius  coincide with the photon centroid, the thin circle indicates the position of the photons during the 2000 observation.
Current usage metrics show cumulative count of Article Views (full-text article views including HTML views, PDF and ePub downloads, according to the available data) and Abstracts Views on Vision4Press platform.
Data correspond to usage on the plateform after 2015. The current usage metrics is available 48-96 hours after online publication and is updated daily on week days.
Initial download of the metrics may take a while.