Fig. B.1
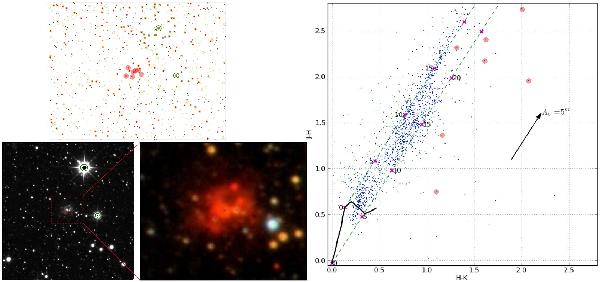
2.5′ by 2.5′ box around cluster candidate 43. The red points in the panel upper left are UKIDSS non-stellar sources brighter than 17m in K, black points other sources brighter than 17m in K and yellow points sources fainter than 17m in K. Brown points are sources listed in 2MASS but not in UKIDSS GPS. Sources encircled by a yellow line do not have coverage in all three bands. The stars encircled by a green line in the catalogue data plot and the WSA grey scale image lower left cause non-stellar classifications and produce false positive clusters: the algorithm removes the sources marked with a green cross. The WSA false colour blow-up image (J image coded in blue, H image in green and K image in red) of the cluster candidate is shown to the right of the grey scale image. Image orientation is North up and East left. All the UKIDSS GPS sources within the catalogue data plot are plotted in the (H−K,J−H) colour–colour plot on the right. Blue dots are sources brighter than 17m and green dots fainter than 17m in K. The red filled circles mark UKIDSS sources (both stellar and non-stellar) in the cluster direction brighter than 17m in K.
Current usage metrics show cumulative count of Article Views (full-text article views including HTML views, PDF and ePub downloads, according to the available data) and Abstracts Views on Vision4Press platform.
Data correspond to usage on the plateform after 2015. The current usage metrics is available 48-96 hours after online publication and is updated daily on week days.
Initial download of the metrics may take a while.