Free Access
Fig. 8
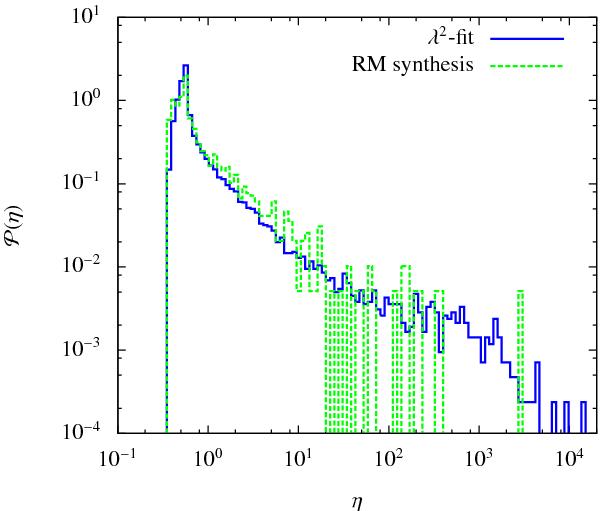
Comparison of the reconstructed distributions of the correction factors η for the two data reduction techniques. The dark solid histogram depicts the distribution for data points obtained from a linear λ2-fit and the light dashed histogram the distribution for data points stemming from RM synthesis studies.
Current usage metrics show cumulative count of Article Views (full-text article views including HTML views, PDF and ePub downloads, according to the available data) and Abstracts Views on Vision4Press platform.
Data correspond to usage on the plateform after 2015. The current usage metrics is available 48-96 hours after online publication and is updated daily on week days.
Initial download of the metrics may take a while.