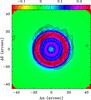
Fig. 7
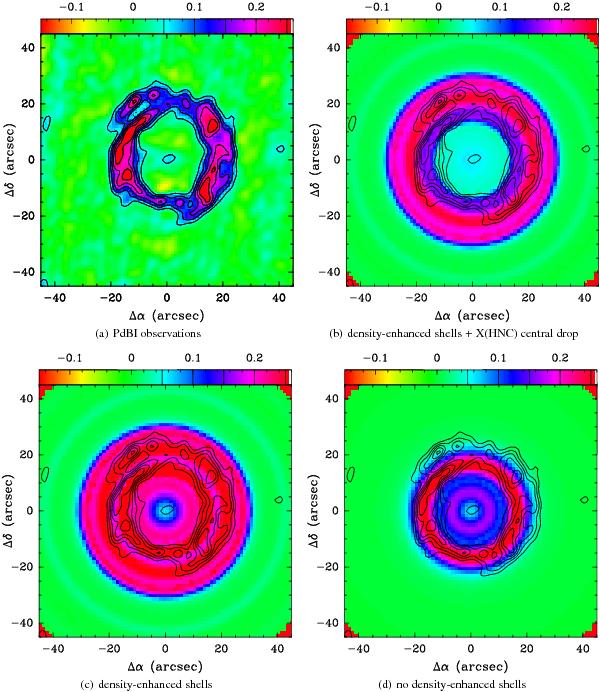
Images of the HNC(J = 1−0) emission integrated over the 10 km s-1 central velocity around the VLSR of the source. The fluxes are given in Jy/beam, with a beam size which correpond to the Plateau de Bure interferometer (~4′′). The various panels correspond to a) IRAM PdBI observations reported in Guélin et al. (1997); b) model with density-enhanced shells and with a central decrease of the abundance (blue curve in Fig. 4); c) model with density-enhanced shells and with the abundance given by the standard chemical model (red curve in Fig. 4); d) model without density-enhanced shells and with the abundance given by the standard chemical model (blue curve in Fig. 8). In panels b)–d), the isocontours correspond to the IRAM PdBI observations displayed in panel a).
Current usage metrics show cumulative count of Article Views (full-text article views including HTML views, PDF and ePub downloads, according to the available data) and Abstracts Views on Vision4Press platform.
Data correspond to usage on the plateform after 2015. The current usage metrics is available 48-96 hours after online publication and is updated daily on week days.
Initial download of the metrics may take a while.