Fig. 3
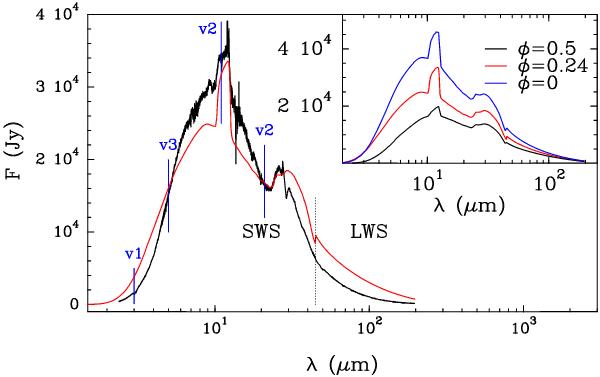
Comparison between the SED of IRC +10 216 as modeled and as observed by ISO at φ = 0.24. Wavelengths of some vibrational transitions of HNC are indicated by vertical lines. The vibrational transition indicated at ~11 μm correspond to the 000 → 020 vibrational band and the transition at ~21 μm to the 000 → 010 and 010 → 020 bands. The dotted vertical line around 45 μm indicates the ISO LWS/SWS division. The inset panel shows the computed SED at different phases.
Current usage metrics show cumulative count of Article Views (full-text article views including HTML views, PDF and ePub downloads, according to the available data) and Abstracts Views on Vision4Press platform.
Data correspond to usage on the plateform after 2015. The current usage metrics is available 48-96 hours after online publication and is updated daily on week days.
Initial download of the metrics may take a while.