Free Access
Fig. 10
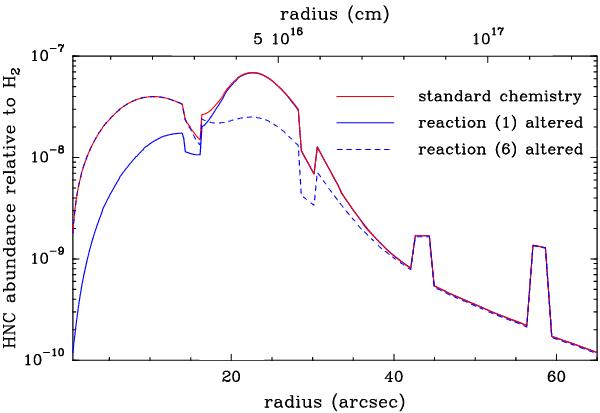
HNC abundance profile derived for various cases. The red curve correspond to the abundance obtained with the standard chemical network. The blue curve is obtained by changing the branching ratio of reaction (1) of Sect. 3.1 and the dashed blue curve removing reaction (6) from the chemical network (see text).
Current usage metrics show cumulative count of Article Views (full-text article views including HTML views, PDF and ePub downloads, according to the available data) and Abstracts Views on Vision4Press platform.
Data correspond to usage on the plateform after 2015. The current usage metrics is available 48-96 hours after online publication and is updated daily on week days.
Initial download of the metrics may take a while.