Fig. 5
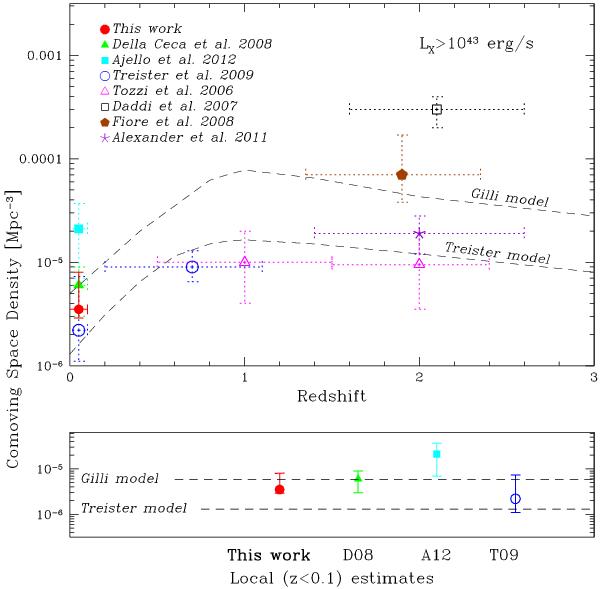
Co-moving space density of Compton-thick AGN. All the data and the model plotted in the figure refer to LX > 1043 erg s-1. Filled circle (red symbol in the electronic version only) is the estimate obtained in this work, while the other local values are taken from Della Ceca et al. (2008b, solid triangle, green symbol in the electronic version), from Ajello et al. (2012, solid square, cyan symbol in the electronic version) and from Treister et al. (2009a, open circle at the local redshift, blue symbol in the electronic version only). As for higher redshift estimates: open circle (blue symbol in the electronic version only), filled pentagon (brown symbol in the electronic version only) and open square are the results obtained from the X-ray stacking analysis of undetected candidate Compton-thick AGN from Treister et al. (2009b), Fiore et al. (2008) and Daddi et al. (2007), respectively. The results obtained fron the X-ray spectral analysis from Tozzi et al. (2006) and Alexander et al. (2011) are marked with open triangles (magenta symbols in the electronic version only) and star (purple symbol in the electronic version only), respectively. The results are compared to the predictions of the models proposed by Gilli et al. (2007) and Treister et al. (2009a), dashed curves. The local co-moving space density estimates are reported also in the lower panel as a function of the different authors.
Current usage metrics show cumulative count of Article Views (full-text article views including HTML views, PDF and ePub downloads, according to the available data) and Abstracts Views on Vision4Press platform.
Data correspond to usage on the plateform after 2015. The current usage metrics is available 48-96 hours after online publication and is updated daily on week days.
Initial download of the metrics may take a while.