Fig. 9
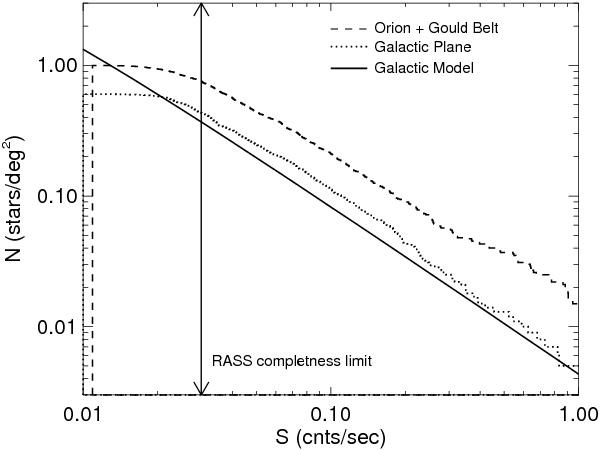
Cumulative log N(>S) − log S distributions for RASS data in the Orion vicinity. A field centered on the Galactic plane is shown with a dotted line. The dashed line includes Orion and a section of the Gould Belt. The solid line corresponds to the prediction of our X-ray models at lII = 200° and zero Galactic latitude. The RASS completeness limit of 0.03 cnts/s is marked with the double arrow.
Current usage metrics show cumulative count of Article Views (full-text article views including HTML views, PDF and ePub downloads, according to the available data) and Abstracts Views on Vision4Press platform.
Data correspond to usage on the plateform after 2015. The current usage metrics is available 48-96 hours after online publication and is updated daily on week days.
Initial download of the metrics may take a while.