Free Access
Fig. 6
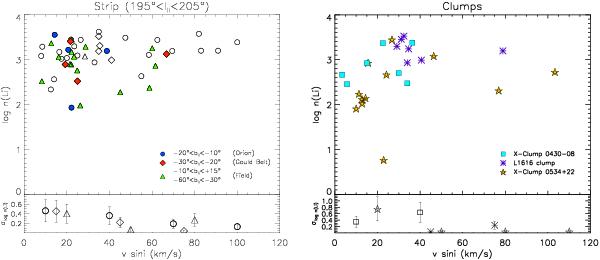
Lithium abundance versus vsini for stars observed at high resolution. Symbols as in Fig. 5. Bottom panels show for each group the log n(Li) dispersion as a function of vsini at the following bins: 0–30, 30–60, 60–90, 90–120 km s-1. The values are shifted in vsini to better visualize the symbols.
This figure is made of several images, please see below:
Current usage metrics show cumulative count of Article Views (full-text article views including HTML views, PDF and ePub downloads, according to the available data) and Abstracts Views on Vision4Press platform.
Data correspond to usage on the plateform after 2015. The current usage metrics is available 48-96 hours after online publication and is updated daily on week days.
Initial download of the metrics may take a while.