Fig. 5
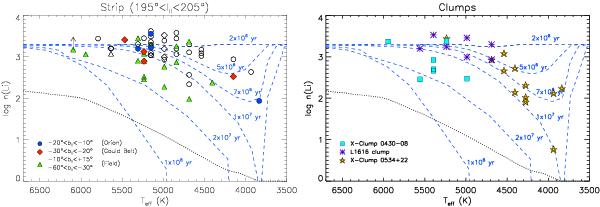
Lithium abundance versus effective temperature for stars observed at high resolution (filled symbols refer to our sample, while open symbols represent the Alcalá et al. (2000) measurements). The “lithium isochrones” by D’Antona & Mazzitelli (1997) in the 2 × 10⁶ − 1 × 10⁸ yr range are overlaid with dashed lines. Dotted lines represent the limiting detectable log n(Li), as derived from the Pavlenko & Magazzù (1996) non-LTE curves-of-growth, assuming 10 mÅ as mean EWLi error and adding quadratically the mean contribution of the iron line at 6707.4 Å computed from the empirical relation obtained by Soderblom et al. (1993) between B − V color and EWFe (Kenyon & Hartmann 1995, tables were used to convert B − V colors into Teff). Left panel: stars located along the strip crossing the GB in the range 195° < lII < 205° (see Fig. 1) and three bins of Galactic latitude. Right panel: stars in known (L1616) and unknown (X-Clump 0430−08 and X-Clump 0534+22) groups.
Current usage metrics show cumulative count of Article Views (full-text article views including HTML views, PDF and ePub downloads, according to the available data) and Abstracts Views on Vision4Press platform.
Data correspond to usage on the plateform after 2015. The current usage metrics is available 48-96 hours after online publication and is updated daily on week days.
Initial download of the metrics may take a while.