Fig. 2
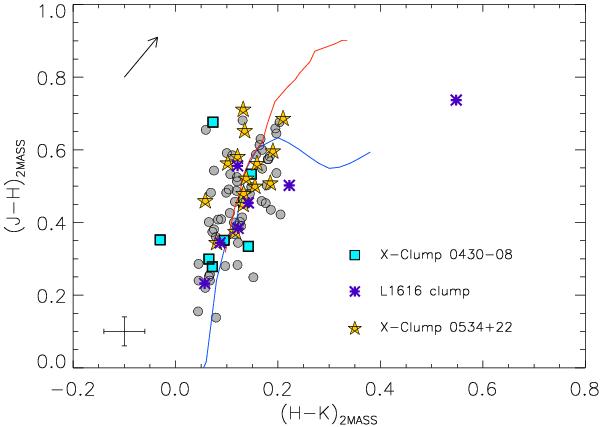
2MASS (J − H) versus (H − K) diagram for the observed sources. Squares, asterisks, and stars represent objects in the three clumps, as indicated in the legend. The circles refer to the “non-clump” stars. The solid curve shows the relation between these indexes for main sequence stars (lower branch; Bessell & Brett 1988) and giants (upper branch; Kenyon & Hartmann 1995), where the 2MASS color trasformations were used. The AV = 1 mag reddening vector is shown with an arrow. The typical 2MASS photometric errors are overplotted on the lower-left corner of the panel.
Current usage metrics show cumulative count of Article Views (full-text article views including HTML views, PDF and ePub downloads, according to the available data) and Abstracts Views on Vision4Press platform.
Data correspond to usage on the plateform after 2015. The current usage metrics is available 48-96 hours after online publication and is updated daily on week days.
Initial download of the metrics may take a while.