Fig. A.2
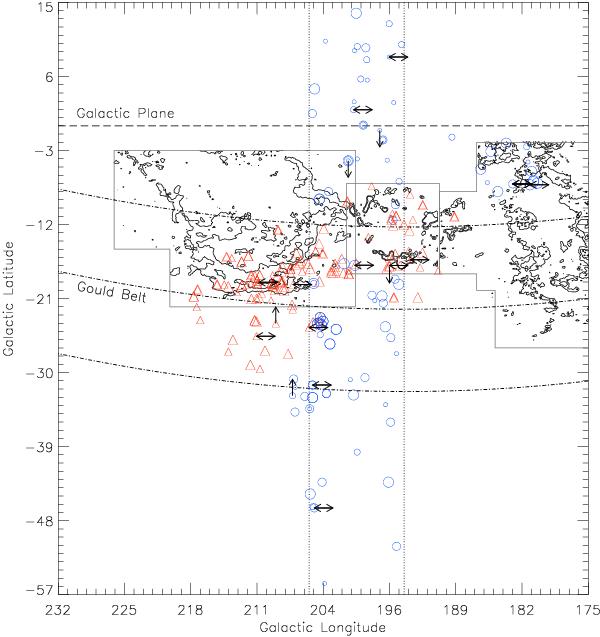
Large-scale spatial distribution of all targets observed at low and/or high resolution. Circles refer to sources observed spectroscopically in this work, while triangles are targets analyzed by Alcalá et al. (1996) and Alcalá et al. (2000). The symbol size increases with the lithium equivalent width (0, < 150, 150–300, > 300 mÅ). The arrows refer to stars for which we measured the iron abundance (downward for [Fe/H] ≤ −0.14, horizontal for −0.14 < [Fe/H] ≤ 0.06, upward for [Fe/H] > 0.06; the central bin corresponds to the average metallicity of our targets ± 1σ). Dotted lines represent the strip, long-dashed line is the Galactic plane, while dash-dotted lines represent the Gould Belt disk, as outlined by Guillout et al. (1998). The CO J = 1 → 0 emission contour maps by Dame et al. (2001) of the Orion, Monoceros, and Taurus molecular clouds, and the λ Orionis H ii region are also overlaid.
Current usage metrics show cumulative count of Article Views (full-text article views including HTML views, PDF and ePub downloads, according to the available data) and Abstracts Views on Vision4Press platform.
Data correspond to usage on the plateform after 2015. The current usage metrics is available 48-96 hours after online publication and is updated daily on week days.
Initial download of the metrics may take a while.