Fig. 1
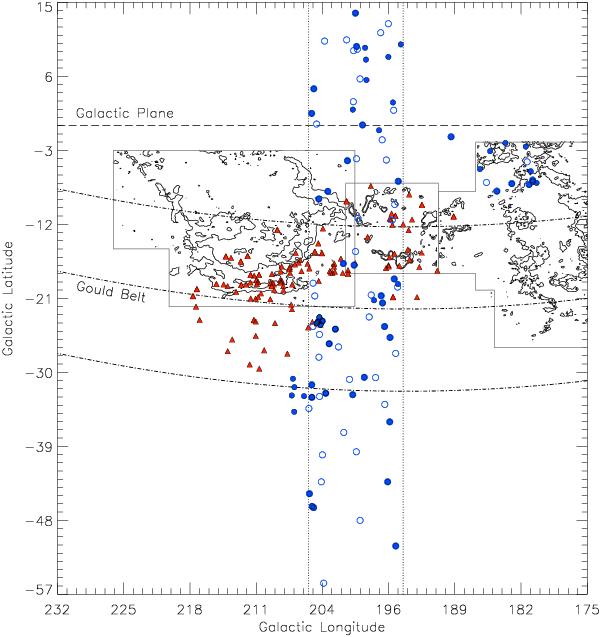
Large-scale spatial distribution of our targets (circles) and those of Alcalá et al. (1996, 2000; triangles). Empty symbols refer to low-resolution spectra, while filled symbols represent objects observed at high resolution. The dotted lines mark the strip, the long-dashed line is the Galactic plane, while the dash-dotted lines represent the Gould Belt disk, as outlined by Guillout et al. (1998). The CO J = 1 → 0 emission contour maps by Dame et al. (2001) of the Orion, Monoceros, and Taurus molecular clouds, and the λ Orionis H ii region are also overlaid.
Current usage metrics show cumulative count of Article Views (full-text article views including HTML views, PDF and ePub downloads, according to the available data) and Abstracts Views on Vision4Press platform.
Data correspond to usage on the plateform after 2015. The current usage metrics is available 48-96 hours after online publication and is updated daily on week days.
Initial download of the metrics may take a while.