Fig. 6
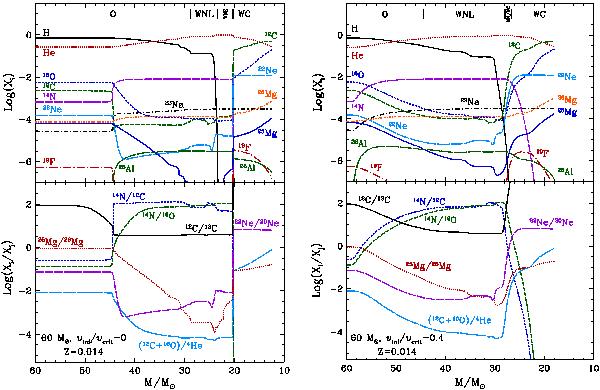
Top left panel: evolution of the surface abundances in mass fraction as a function of the actual mass of the star for the non-rotating 60 M⊙ model. Different evolutionary phases are indicated in the upper part of the figure. A very narrow region, just before the WC phase, corresponds to the WNC phase (not labelled in the figure for clarity). Bottom left panel: evolution of abundance ratios (in number) as a function of the actual mass of the star. Right panels: Same as the left panels for the rotating model.
Current usage metrics show cumulative count of Article Views (full-text article views including HTML views, PDF and ePub downloads, according to the available data) and Abstracts Views on Vision4Press platform.
Data correspond to usage on the plateform after 2015. The current usage metrics is available 48-96 hours after online publication and is updated daily on week days.
Initial download of the metrics may take a while.