Free Access
Fig. 5
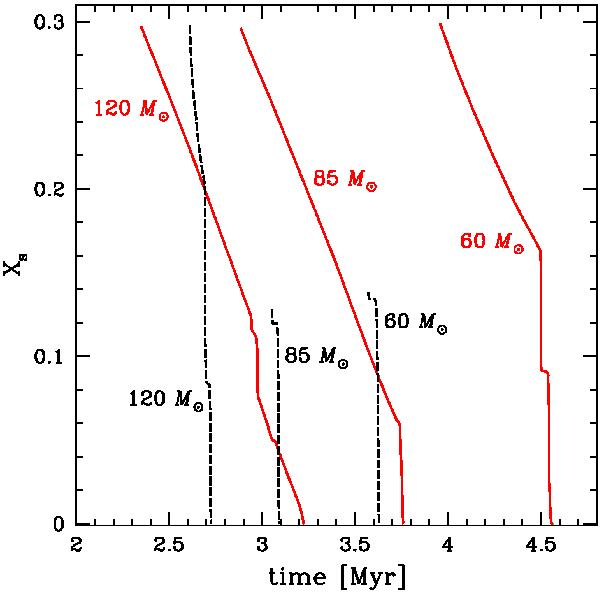
Evolution of the mass fraction of hydrogen at the surface as a function of time during the WNL phase. The continuous red lines correspond to rotating models, while the dashed black lines correspond to non-rotating ones. The corresponding masses are indicated near the curves.
Current usage metrics show cumulative count of Article Views (full-text article views including HTML views, PDF and ePub downloads, according to the available data) and Abstracts Views on Vision4Press platform.
Data correspond to usage on the plateform after 2015. The current usage metrics is available 48-96 hours after online publication and is updated daily on week days.
Initial download of the metrics may take a while.