Fig. 4
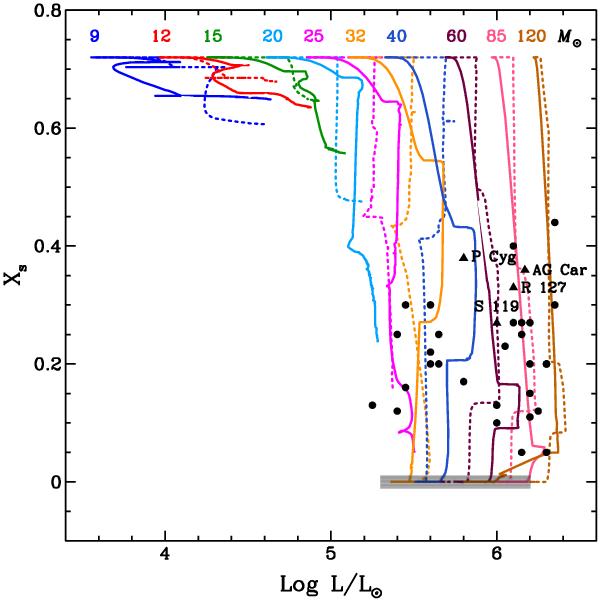
Evolution of the mass fraction of hydrogen at the surface as a function of the luminosity. The continuous lines are the present rotating models, while the dotted lines represent the non-rotating ones. The dots are the WN stars with non-zero H-abundance and the shaded zone shows the range in luminosity of the WN stars with no H detected at the surface by Hamann et al. (2006). The triangles are LBV stars (Groh et al. 2009; Lamers et al. 2001). In this graph, models start at the top on the MS. They evolve to the right as their luminosity increases and downwards with mass loss peeling off the hydrogen-rich layers. The most massive models evolve back to the left (decreasing luminosity) due to the strong mass loss in the WR phase.
Current usage metrics show cumulative count of Article Views (full-text article views including HTML views, PDF and ePub downloads, according to the available data) and Abstracts Views on Vision4Press platform.
Data correspond to usage on the plateform after 2015. The current usage metrics is available 48-96 hours after online publication and is updated daily on week days.
Initial download of the metrics may take a while.