Fig. 1
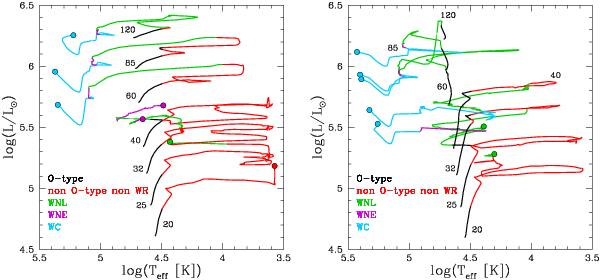
HRD of the massive models from 20 to 120 M⊙ with the different types/phases marked in colours (O-type: blue; neither O-type nor WR: red; WNL: green; WNE: purple; WC: cyan). Left: non-rotating models. Right: rotating models. We plotted the effective temperature at the surface of the hydrostatic core. The endpoints of the tracks are indicated by a circle.
Current usage metrics show cumulative count of Article Views (full-text article views including HTML views, PDF and ePub downloads, according to the available data) and Abstracts Views on Vision4Press platform.
Data correspond to usage on the plateform after 2015. The current usage metrics is available 48-96 hours after online publication and is updated daily on week days.
Initial download of the metrics may take a while.