Free Access
Fig. 7
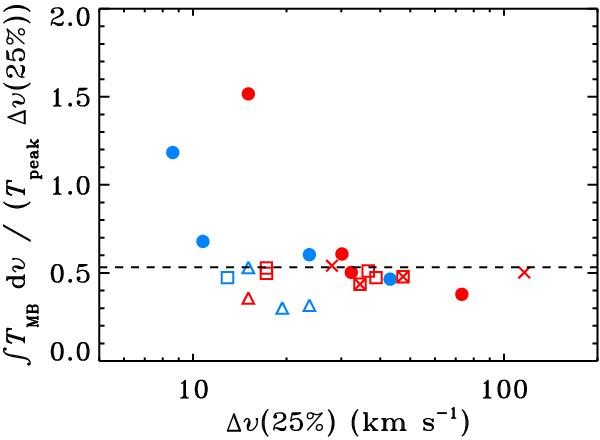
Correlation between the width measured at the 25% level of the peak intensity, Tpeak and the integrated intensity ( dν) divided by Tpeak. Symbols are as in Fig. 6. The thick dashed line is for a proportionality constant of 0.53, corresponding to a Gaussian curve.
Current usage metrics show cumulative count of Article Views (full-text article views including HTML views, PDF and ePub downloads, according to the available data) and Abstracts Views on Vision4Press platform.
Data correspond to usage on the plateform after 2015. The current usage metrics is available 48-96 hours after online publication and is updated daily on week days.
Initial download of the metrics may take a while.