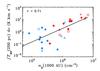
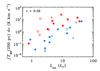
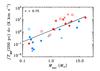
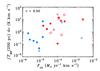
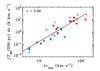
Fig. 6
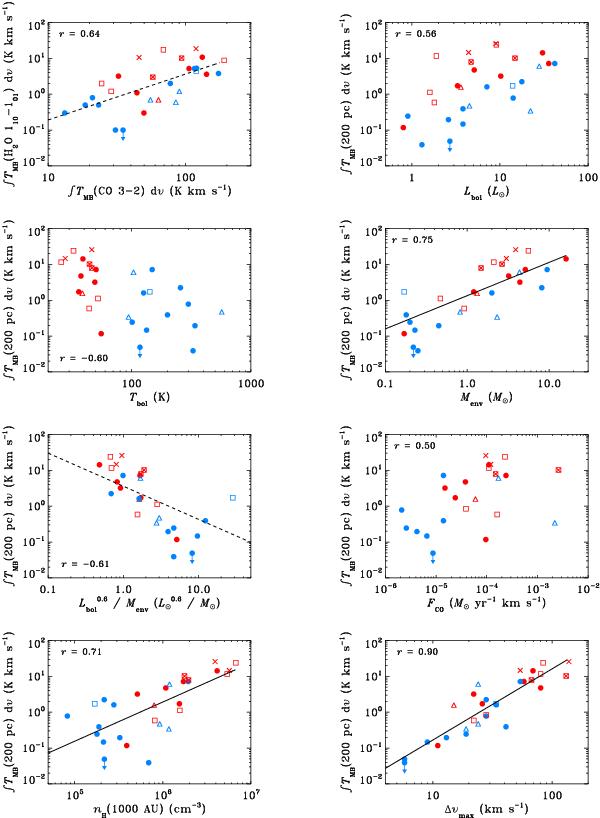
Correlation plots showing the integrated H2O 110–101 557 GHz line intensity scaled to a distance of 200 pc as a function of various envelope parameters; the H2O intensity is not scaled when comparing to CO 3–2 emission. Class 0 sources are marked in red, Class I sources in blue; sources with bullet emission are marked with crosses, inverse P-Cygni profiles with squares and regular P-Cygni profiles with triangles; the upper limit for TMC1A is marked with an arrow. Strong correlations (|r| > 0.7) are marked with full lines, tentative correlations (0.6 < |r| < 0.7) with dashed lines. The parameters are (from left to right, top to bottom): CO 3–2 emission, Lbol, Tbol, Menv, the evolutionary parameter  , FCO, n(1000 AU) and Δνmax.
Current usage metrics show cumulative count of Article Views (full-text article views including HTML views, PDF and ePub downloads, according to the available data) and Abstracts Views on Vision4Press platform.
Data correspond to usage on the plateform after 2015. The current usage metrics is available 48-96 hours after online publication and is updated daily on week days.
Initial download of the metrics may take a while.