Free Access
Fig. 3
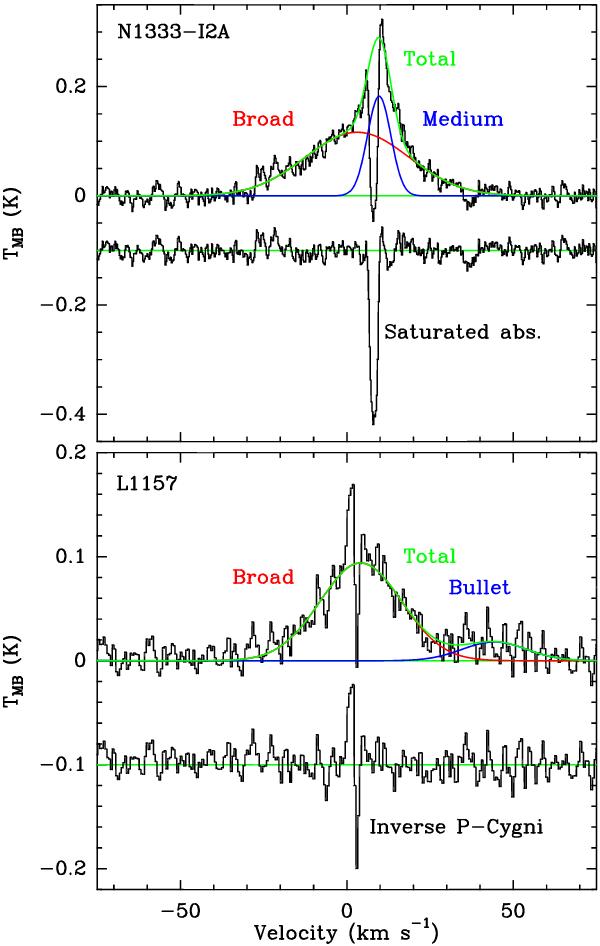
Gaussian decomposition of the H2O 110–101 spectra towards the two sources NGC 1333-IRAS2A and L1157. The individual Gaussian components are shown overlaid on the spectra and the residual is plotted below. The saturated absorption and inverse P-Cygni profile are not fitted by Gaussians.
This figure is made of several images, please see below:
Current usage metrics show cumulative count of Article Views (full-text article views including HTML views, PDF and ePub downloads, according to the available data) and Abstracts Views on Vision4Press platform.
Data correspond to usage on the plateform after 2015. The current usage metrics is available 48-96 hours after online publication and is updated daily on week days.
Initial download of the metrics may take a while.