Free Access
Fig. B.1
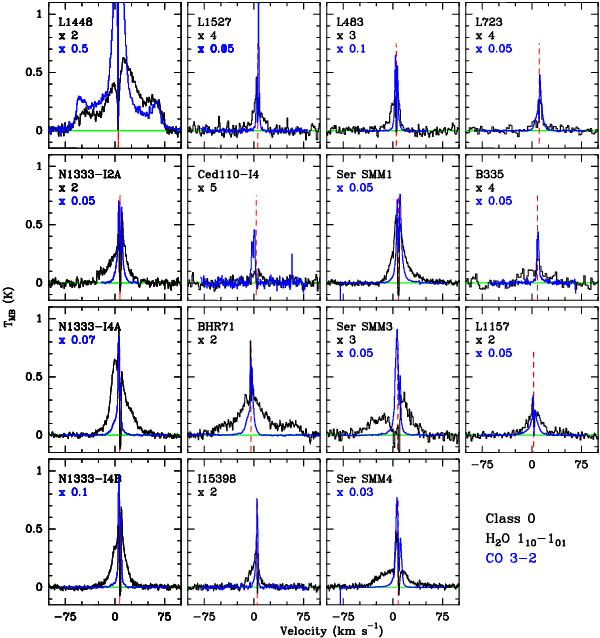
Continuum-subtracted H2O 110–101 spectra of the observed Class 0 sources as presented in Fig. 1 with CO 3–2 spectra scaled and overplotted in blue. The CO 3–2 scaling factor is written in blue for each spectrum.
Current usage metrics show cumulative count of Article Views (full-text article views including HTML views, PDF and ePub downloads, according to the available data) and Abstracts Views on Vision4Press platform.
Data correspond to usage on the plateform after 2015. The current usage metrics is available 48-96 hours after online publication and is updated daily on week days.
Initial download of the metrics may take a while.