Fig. A.1
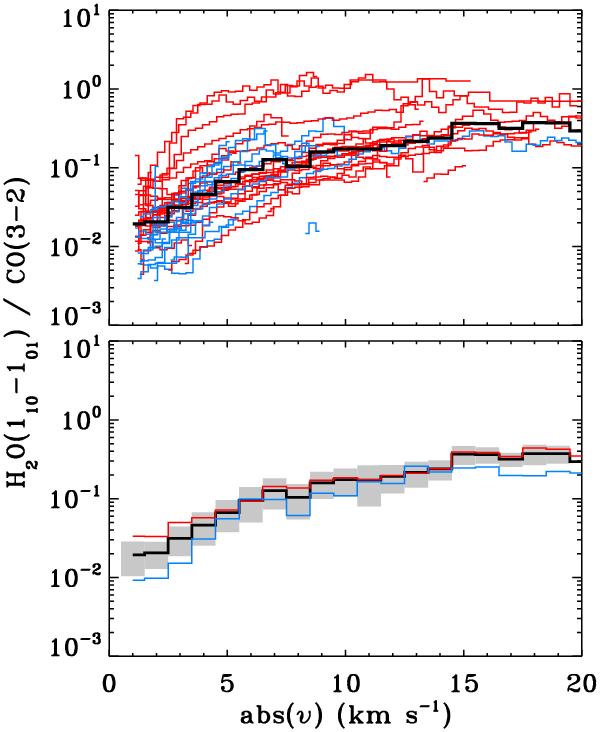
Emission ratio of H2O 110–101/CO 3–2 as a function of absolute velocity. All spectra have been centred at 0 km s-1. The top panel shows the ratio for all line wings where both H2O and CO emission exceeds 4σ. Line wings from Class 0 sources are shown in red, wings from Class I sources in blue. The average value is shown in black. The bottom panel shows the average value with the standard deviation shown in grey. The average values for the Class 0 and Class I sources in red and blue, respectively. The average ratios are taken in 1 km s-1 bins.
Current usage metrics show cumulative count of Article Views (full-text article views including HTML views, PDF and ePub downloads, according to the available data) and Abstracts Views on Vision4Press platform.
Data correspond to usage on the plateform after 2015. The current usage metrics is available 48-96 hours after online publication and is updated daily on week days.
Initial download of the metrics may take a while.