Fig. 9
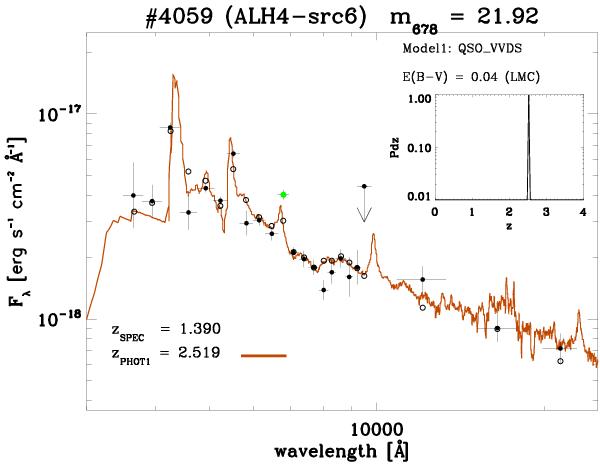
Example of a source with a dubious spectro-z of 1.39. The ALHAMBRA photometry and errors, represented by the black dots and crosses, provide a photo-z solution (continuous line) of 2.53 with peak emission-lines from Lα, C III] , and C IV clearly visible at ~4300, ~5400 and ~6700 Å respectively. Lines and symbols as in Fig. 4. The spectra of this source is currently unavailable to the public.
Current usage metrics show cumulative count of Article Views (full-text article views including HTML views, PDF and ePub downloads, according to the available data) and Abstracts Views on Vision4Press platform.
Data correspond to usage on the plateform after 2015. The current usage metrics is available 48-96 hours after online publication and is updated daily on week days.
Initial download of the metrics may take a while.