Fig. 6
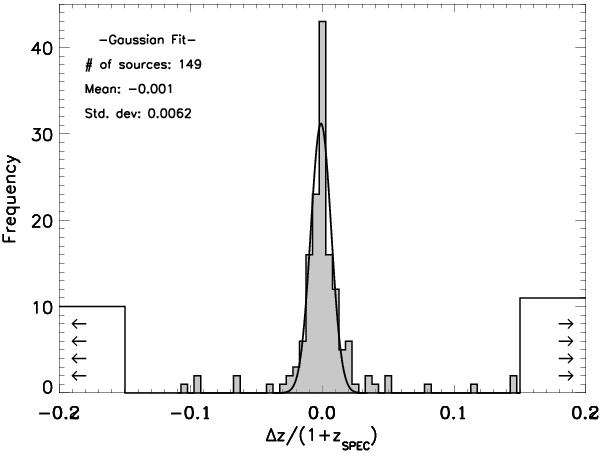
Uncertainty distribution, Δz/(1 + z), for the 170 BLAGN/QSOs in our sample considering the MEL approach. Non-outlier and outliers are represented by filled and open histograms, respectively. The continuous line represents the best Gaussian fit to the observed distribution of non-outliers. The number of non-outliers (#), the center, and σ of the best-fit Gaussian distribution are indicated.
Current usage metrics show cumulative count of Article Views (full-text article views including HTML views, PDF and ePub downloads, according to the available data) and Abstracts Views on Vision4Press platform.
Data correspond to usage on the plateform after 2015. The current usage metrics is available 48-96 hours after online publication and is updated daily on week days.
Initial download of the metrics may take a while.