Fig. 5
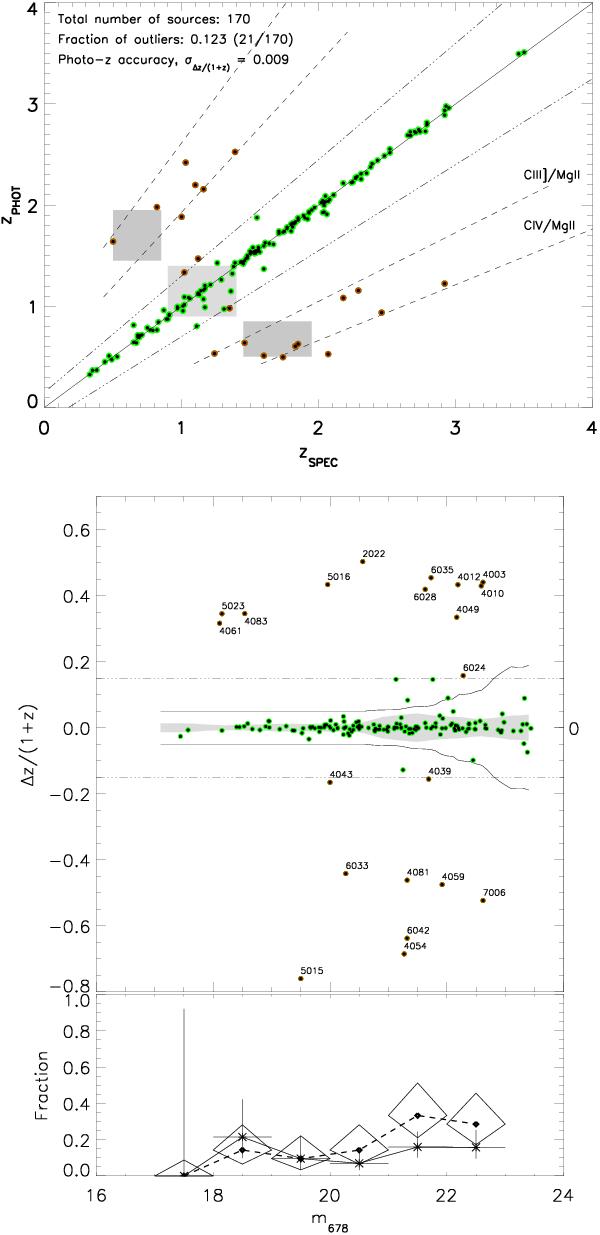
Photo-z efficiency using several extinction laws (the MEL solution). Top: comparison between the best fit photo-z solution and the measured spectro-z shows a good agreement between the both. The continuous line gives the zphot = zspec relation while the dashed line represent the boundary between good solutions (green dots) and outliers (red, indexed dots) and defined as |Δz|/(1 + zspec) > 0.15. Central: distribution of Δz/(1 + zspec) as a function of the ALHAMBRA magnitude m678. The mean magnitude error, per magnitude interval of Δm = 1, of the filter A678M is indicated by the continuous lines. The accuracy per magnitude interval (Δm = 1) is highlighted by a grey shaded area. This accuracy shows a small correlation with apparent magnitude. Bottom: this panel shows the contribution of each magnitude bin (Δm = 1) to the outlier population as filled diamonds connected by a dashed line. The magnitude intervals considered and the associated errors are indicated by the large diamonds. The fraction of outliers with respect to the number of sources in the same magnitude intervals are given by asterisks connected by a continuous line. The magnitude intervals and the associated errors are indicated by the large vertical and horizontal lines. In both cases, errors are assumed to be Poissonian and were calculated following Gehrels (1986).
Current usage metrics show cumulative count of Article Views (full-text article views including HTML views, PDF and ePub downloads, according to the available data) and Abstracts Views on Vision4Press platform.
Data correspond to usage on the plateform after 2015. The current usage metrics is available 48-96 hours after online publication and is updated daily on week days.
Initial download of the metrics may take a while.