Fig. 10
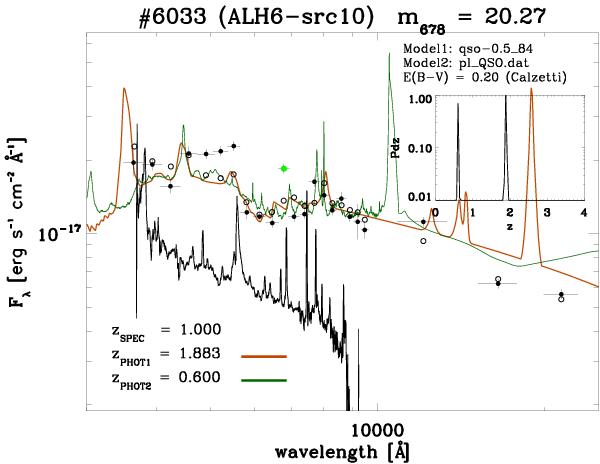
Example of an object with a strange ALHAMBRA SED probably caused by intrinsic variability during the time in which photometry was taken. Lines and symbols as in Fig. 4. We also indicate with a green line a possible secondary solution with zPHOT = 0.6. As a comparison, we include the observed spectra with a continuous black solid line. Since no flux calibration is provided with the observed spectra, we scale the flux accordingly to fit the plot scale. The observed spectra has been smoothed using a 20 pixel box.
Current usage metrics show cumulative count of Article Views (full-text article views including HTML views, PDF and ePub downloads, according to the available data) and Abstracts Views on Vision4Press platform.
Data correspond to usage on the plateform after 2015. The current usage metrics is available 48-96 hours after online publication and is updated daily on week days.
Initial download of the metrics may take a while.