Fig. 8
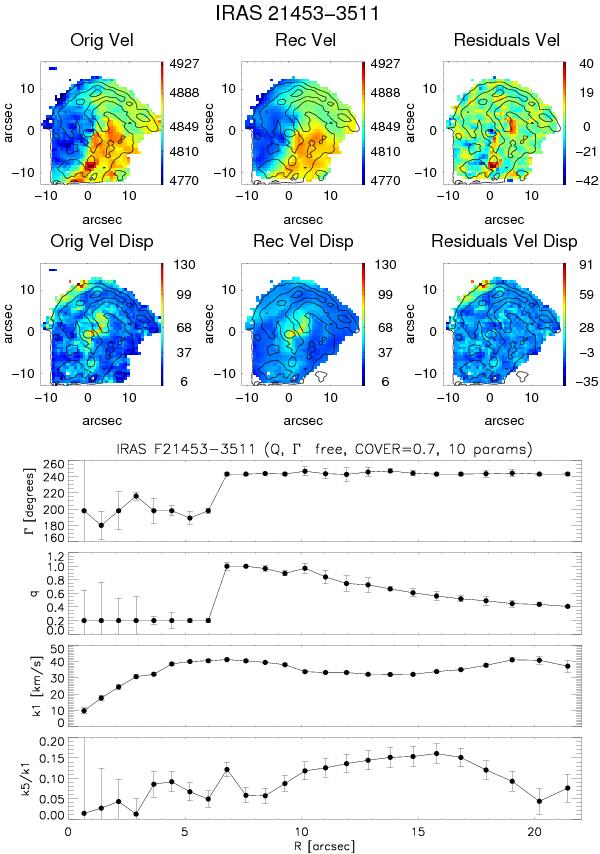
Upper panel: maps of Hα Gaussian fit velocities (top left), Hα Gaussian fit dispersion (bottom left) and their respective reconstructed (middle) and residual (data-model) maps (on the right) for IRAS F21453-3511. Lower panel: radial profiles of the kinematic properties, obtained using kinemetry program. The position angle Γ and the flattening q of the best-fit ellipses, as well as the first and the fifth order Fourier terms (respectively, k1 and k5) are plotted as a function of the radius.
Current usage metrics show cumulative count of Article Views (full-text article views including HTML views, PDF and ePub downloads, according to the available data) and Abstracts Views on Vision4Press platform.
Data correspond to usage on the plateform after 2015. The current usage metrics is available 48-96 hours after online publication and is updated daily on week days.
Initial download of the metrics may take a while.