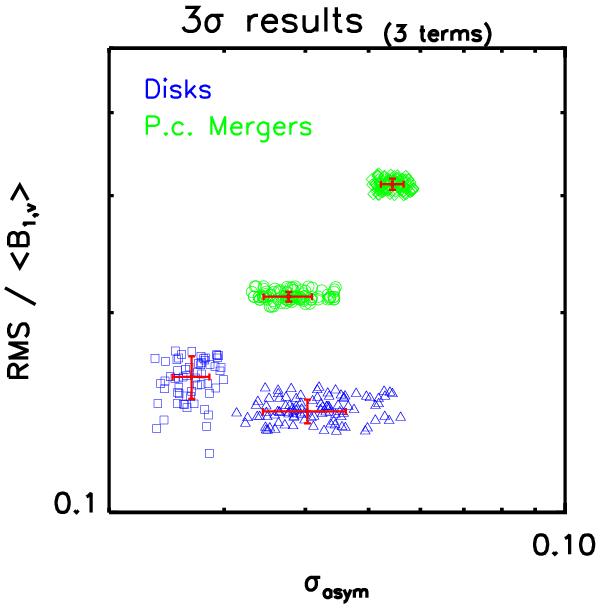
Fig. A.2

Subtracting the circular motion (i.e., B1 coefficient) from the data, we end up with the velocity residual maps, characterized by mean residuals close to zero and an rms smaller than 20 km s-1 for the whole sample. If we assume that the four objects have almost the same rms, this plot clearly implies higher circular velocities for the class 0 galaxies, while we note that a lower B1 term is derived for the class 2 ones. Their rotation is clearly shown in Figs. 5 − 8.
Current usage metrics show cumulative count of Article Views (full-text article views including HTML views, PDF and ePub downloads, according to the available data) and Abstracts Views on Vision4Press platform.
Data correspond to usage on the plateform after 2015. The current usage metrics is available 48-96 hours after online publication and is updated daily on week days.
Initial download of the metrics may take a while.


