Free Access
Fig. 15
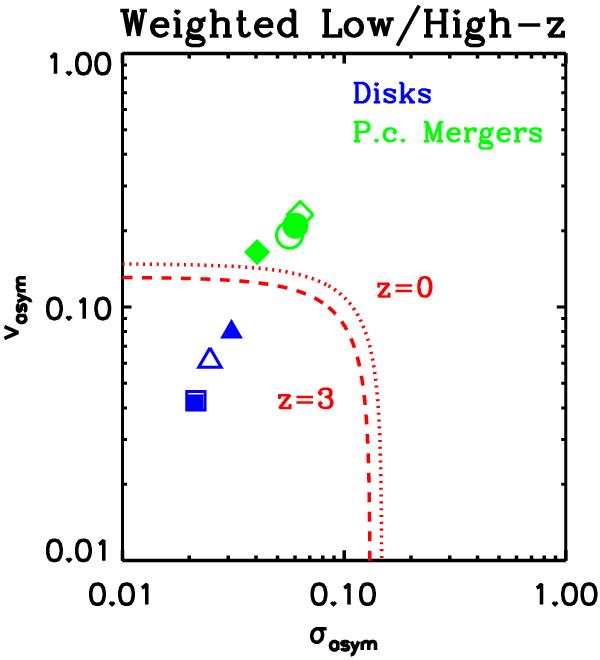
Comparison between local and z = 3 results in the W-[σa − va] plane. Empty symbols represent low-z results, while filled ones are for z = 3. The red dashed line represents the high-z frontier, while the dotted one is for the local case.
Current usage metrics show cumulative count of Article Views (full-text article views including HTML views, PDF and ePub downloads, according to the available data) and Abstracts Views on Vision4Press platform.
Data correspond to usage on the plateform after 2015. The current usage metrics is available 48-96 hours after online publication and is updated daily on week days.
Initial download of the metrics may take a while.