Fig. 11
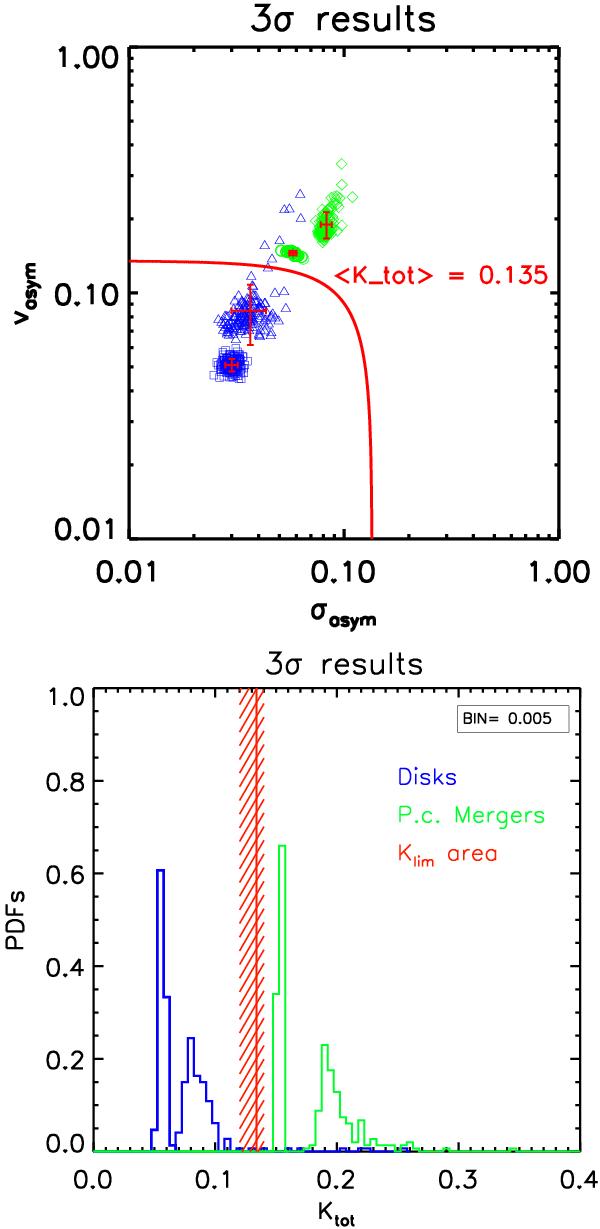
Top: asymmetry measures of the velocity vasym and velocity dispersion σasym fields derived from the Monte Carlo realizations for the four objects. For each source, 150 MC simulations are run but here only the ± 3σ results are shown. The solid red line indicates the division between class 0 (disks) and class 2 (post-coalescence mergers) at ⟨ Ktot ⟩ = 0.135. Bottom: the probability distribution function (PDFs) as derived from MC realizations. The empirical delineation where Klim = 0.135 can cleanly separate the two classes (i.e., Klim area). The symbols are the same as those used before.
Current usage metrics show cumulative count of Article Views (full-text article views including HTML views, PDF and ePub downloads, according to the available data) and Abstracts Views on Vision4Press platform.
Data correspond to usage on the plateform after 2015. The current usage metrics is available 48-96 hours after online publication and is updated daily on week days.
Initial download of the metrics may take a while.