Fig. 10
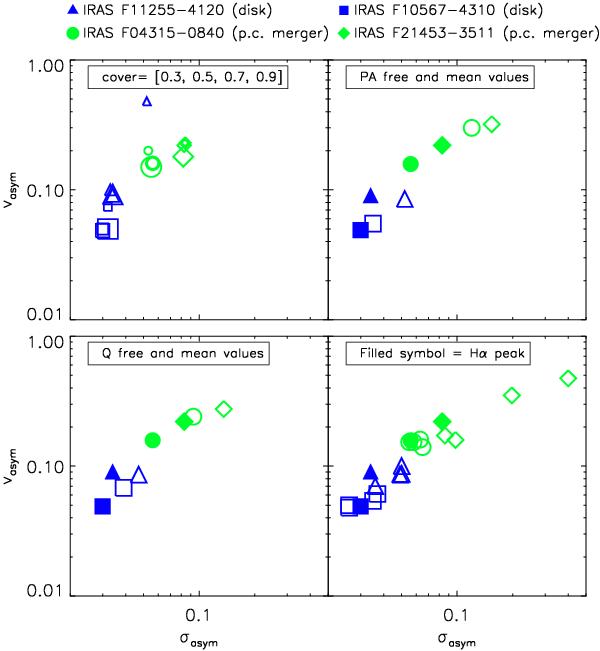
Results for the asymmetry measures when different sets of input parameters are considered with a ten harmonic term analysis. Symbol types and colors help us to distinguish among the different systems as explained in the legend. In each panel, one parameter at a time is changed, namely respectively, COVER, Γ (or PA), q, and the CENTER of the ellipses. Top-left: different results for the COVER parameter (i.e., 0.3, 0.5, 0.7, 0.9) where the size of the symbol is proportional to the COVER value (the biggest symbol corresponds to the highest cover value and vice versa). Top-right: the results obtained when we allow a position angle Γ to vary (filled symbols) or be fixed to its mean value (empty symbols) are shown. Bottom-left: the results shown are obtained when we allow q to either vary or remain constant with radius at its mean value. Bottom-right: results achieved choosing five different centers for each galaxy: filled symbols represent results obtained from the “standard” analysis (Hα flux peak), and empty symbols the results obtained by shifting their center by one pixel (horizontally and vertically, with respect to the Hα peak pixel corresponding to a shift of 0.95′′).
Current usage metrics show cumulative count of Article Views (full-text article views including HTML views, PDF and ePub downloads, according to the available data) and Abstracts Views on Vision4Press platform.
Data correspond to usage on the plateform after 2015. The current usage metrics is available 48-96 hours after online publication and is updated daily on week days.
Initial download of the metrics may take a while.