Fig. 1
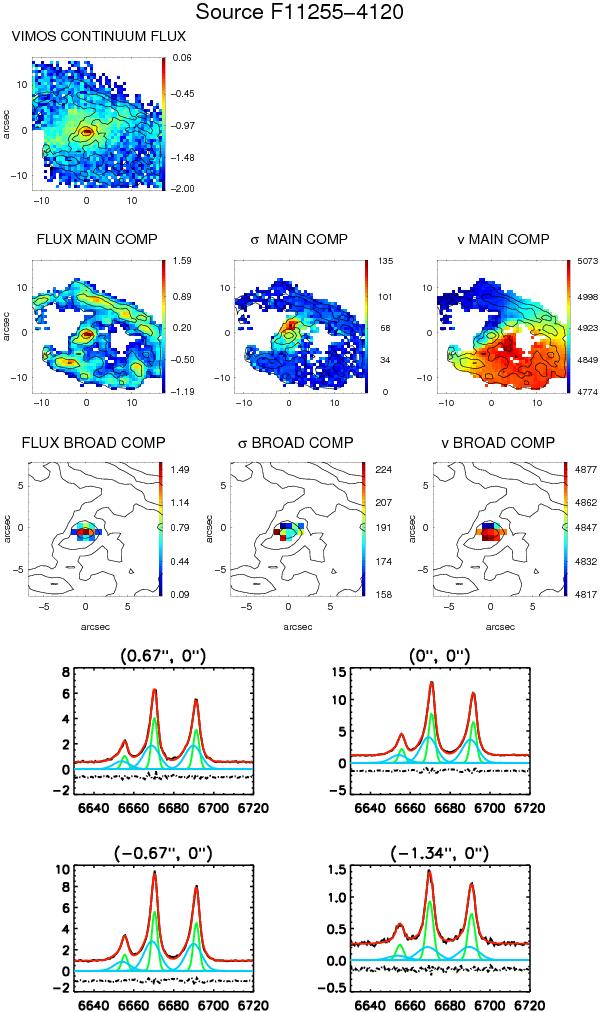
Top panel: upper row: Hα maps for the class 0 object IRAS F11255-4120. VIMOS continuum image; HST continuum images are unavailable for this galaxy. Middle row: the flux intensity, velocity dispersion σ (km s-1), and velocity field v maps (km s-1) for the main component. Lower row: respective maps for the broad component. Note the different FoV between the main and the broad components. The latter has been zoomed because it covers a small area. The flux intensity maps are represented on a logarithmic scale and in arbitrary flux units. All the images are centered using the Hα flux intensity peak and the iso-contours of the Hα flux are overplotted. Bottom panel: Hα-[NII] observed spectra of IRAS F11255-4120 for selected inner regions (indicated by the coordinates in the top label using the same reference system as in the top panel) where the main and broad components coexist. The red curve shows the total Hα-[NII] components obtained from multi-component Gaussian fits. The green and blue curves represent, respectively, the main and broad components.
Current usage metrics show cumulative count of Article Views (full-text article views including HTML views, PDF and ePub downloads, according to the available data) and Abstracts Views on Vision4Press platform.
Data correspond to usage on the plateform after 2015. The current usage metrics is available 48-96 hours after online publication and is updated daily on week days.
Initial download of the metrics may take a while.