Fig. 3
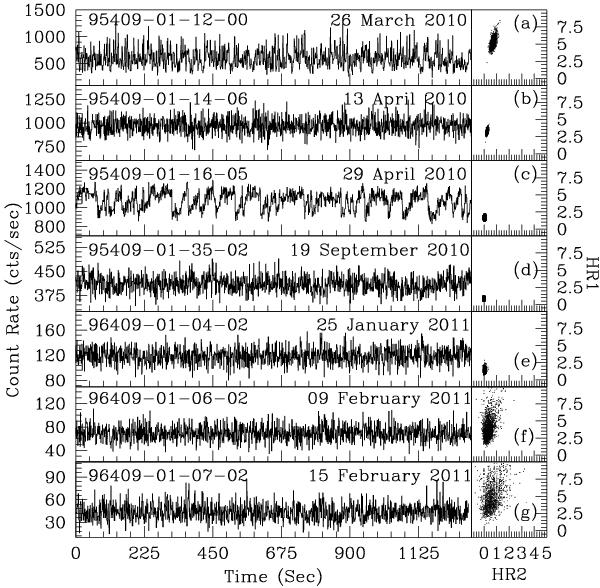
a–g) In each plot, we plot in the left panel the 2–25 keV PCA light curve and in the right panel the color–color diagram are plotted. These plots a–g) are associated with MJD 55 281, MJD 55 299, MJD 55 315, MJD 55 458, MJD 55 586, MJD 55 601, and MJD 55 607, respectively and represent seven different spectral states of the outburst of GX 339-4.
Current usage metrics show cumulative count of Article Views (full-text article views including HTML views, PDF and ePub downloads, according to the available data) and Abstracts Views on Vision4Press platform.
Data correspond to usage on the plateform after 2015. The current usage metrics is available 48-96 hours after online publication and is updated daily on week days.
Initial download of the metrics may take a while.