Fig. 2
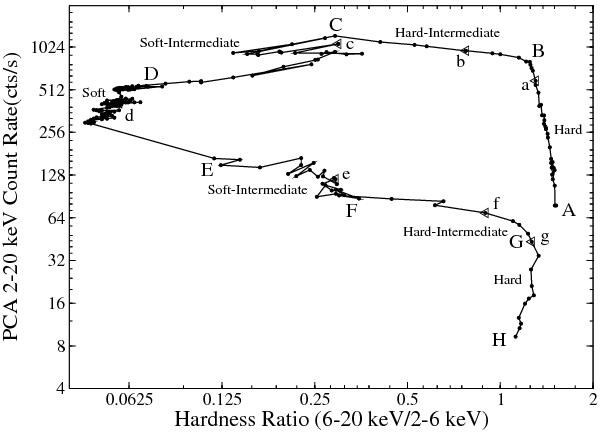
Hardness intensity diagram of GX 339-4 in the 2010-11 outburst observed with RXTE/PCA. We have plotted the total count rates in 2–20 keV energy band along Y-axis and the ratio of the count rates in the 6–20 keV to 2–6 keV bands along the X-axis. The points A, B, C, D, E, F, G, and H are observations on MJD 55 208, MJD 55 296, MJD 55 304, MJD 55 331, MJD 55 565, MJD 55 594, MJD 55 606, and MJD 55 626, respectively, which indicate the start/state transitions/end of our observation. In addition, the points a, b, c, d, e, f, and g (marked with triangle on plot) are the seven observed points from seven different states, whose detailed timing and spectral results are discussed in this paper. Note that the X and Y axes are on logarithmic scales.
Current usage metrics show cumulative count of Article Views (full-text article views including HTML views, PDF and ePub downloads, according to the available data) and Abstracts Views on Vision4Press platform.
Data correspond to usage on the plateform after 2015. The current usage metrics is available 48-96 hours after online publication and is updated daily on week days.
Initial download of the metrics may take a while.