Free Access
Fig. 10
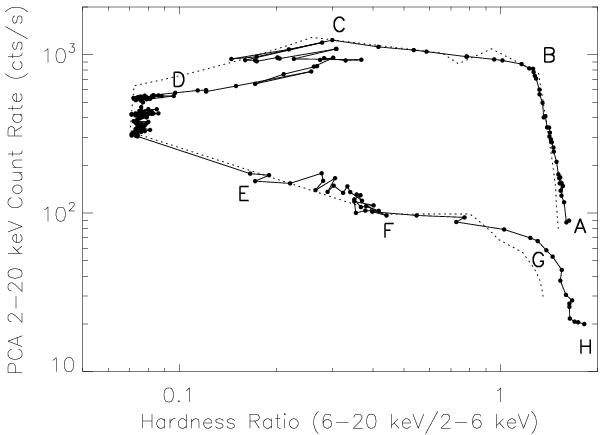
Two component accretion flow model fitted (dotted curve) HID of GX 339-4 during the 2010-11 outburst. The solid curve with points show the observed data as shown in Fig. 2 and indicators A − H are also have the same meanings.
Current usage metrics show cumulative count of Article Views (full-text article views including HTML views, PDF and ePub downloads, according to the available data) and Abstracts Views on Vision4Press platform.
Data correspond to usage on the plateform after 2015. The current usage metrics is available 48-96 hours after online publication and is updated daily on week days.
Initial download of the metrics may take a while.