Fig. 4
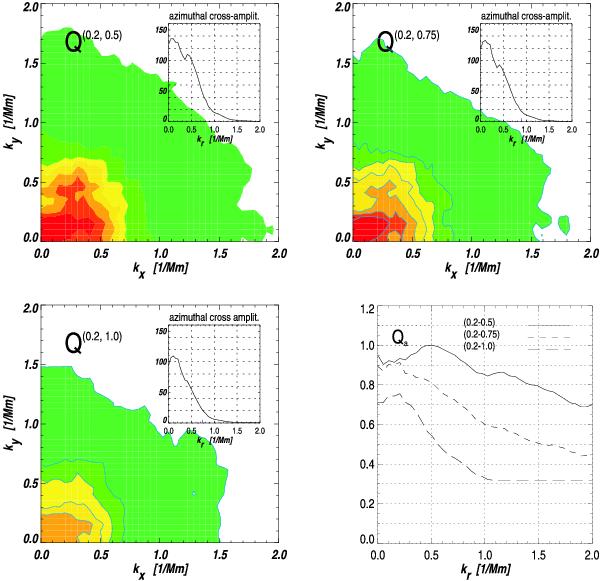
2D velocity cross-amplitude power Q(0.2, 0.5),
Q(0.2, 0.75), and
Q(0.2, 1.0), derived from the corresponding
velocity cross spectra, at the same time step as in Fig. 2. The cross spectra are obtained by correlating the velocity
measurements at the line bisector level 0.2 and the velocity measurements at the
bisector levels 0.5, 0.75, and line core, respectively. The axes of these first
three panels represent the wave numbers
kx and
ky. The cross amplitude power in
these 2D spectra is indicated by different colors from red (maximum power) to green
(minimum power). The insets show the corresponding mean azimuthal cross-amplitude
power
Qa(kr) .
The lower right panel shows the three mean azimuthal cross
amplitude spectra  (full line),
  (dashed), and
  (long dashed), respectively, normalized to the mean azimuthal velocity power at the
line bisector 0.2,
(long dashed), respectively, normalized to the mean azimuthal velocity power at the
line bisector 0.2,  .
.
Current usage metrics show cumulative count of Article Views (full-text article views including HTML views, PDF and ePub downloads, according to the available data) and Abstracts Views on Vision4Press platform.
Data correspond to usage on the plateform after 2015. The current usage metrics is available 48-96 hours after online publication and is updated daily on week days.
Initial download of the metrics may take a while.