Fig. 3
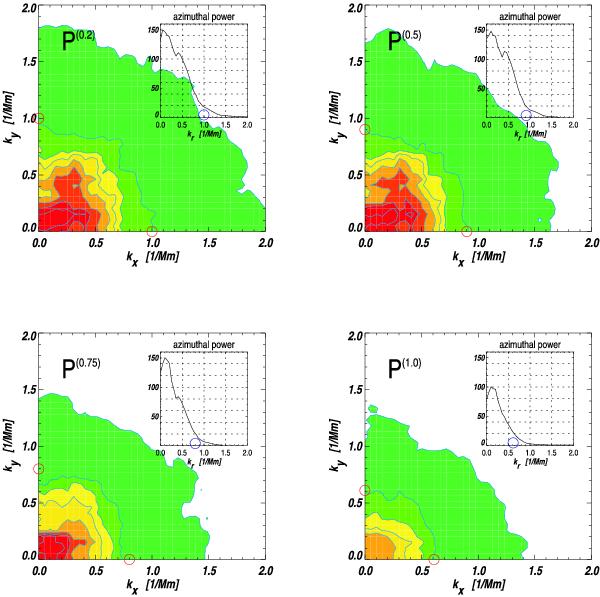
2D spatial power spectra of the velocity fields measured at four bisector levels, for the same scan as shown in Fig. 2. The upper row shows two power maps corresponding to the velocity fields measured at the bisectors 0.2 (left) and 0.5 (right). The second row corresponds to the velocity fields measured at the bisectors 0.75 (left) and line core (right). The axes are the wave numbers kx and ky. The power is color coded from red (maximum power) to green (minimum power). The insets show the corresponding mean azimuthal power Pa . The small circles mark the wave number at which the signal disappears below a certain common threshold.
Current usage metrics show cumulative count of Article Views (full-text article views including HTML views, PDF and ePub downloads, according to the available data) and Abstracts Views on Vision4Press platform.
Data correspond to usage on the plateform after 2015. The current usage metrics is available 48-96 hours after online publication and is updated daily on week days.
Initial download of the metrics may take a while.