Fig. 2
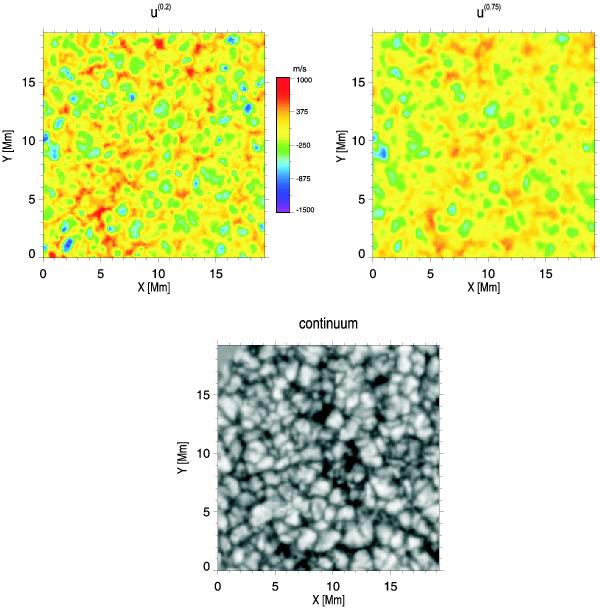
Continuum image together with the maps of radial velocities derived from the Doppler shifts at bisector levels 0.2 and 0.75 (relative line depressions, see Fig. 1) for one of the selected scans (No. 5, taken 2.25 min after the start of the series). The color coding for the velocities is shown in the middle of the upper row.
Current usage metrics show cumulative count of Article Views (full-text article views including HTML views, PDF and ePub downloads, according to the available data) and Abstracts Views on Vision4Press platform.
Data correspond to usage on the plateform after 2015. The current usage metrics is available 48-96 hours after online publication and is updated daily on week days.
Initial download of the metrics may take a while.