Fig. 4
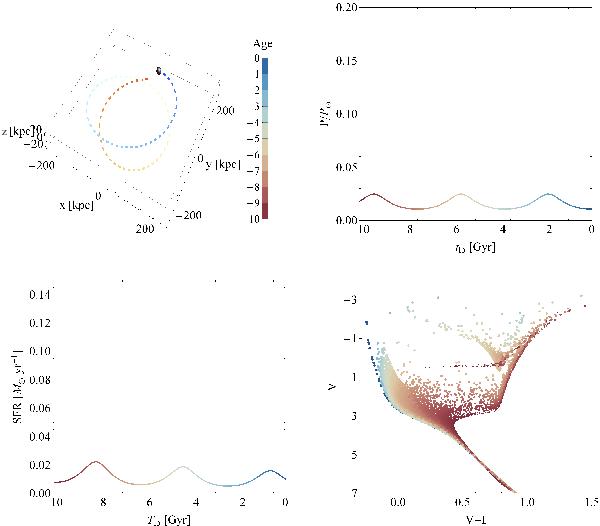
The path (upper left panel), the resulting pressure profile (upper right panel) normalized to P⊙ defined in the text, the star formation rate (lower left panel) and the resulting CMD (lower right panel) for a test satellite orbit with eccentricity e = 25 and baryonic mass Mb ≅ 107 M⊙. The colour bar is plotted only in the upper left panel, red for the oldest stars at the beginning of the orbital path t = 0, blue for the youngest stars born after 10 Gyr of orbital evolution. tlb is the look-back time in Gyr. In the CMD the size of the dots is proportional to the metallicity Z of the stars as obtained the Padova CMD simulator YZVAR fed with the stellar models of Bertelli et al. (2009) (metal rich stars are indicated by large dots).
Current usage metrics show cumulative count of Article Views (full-text article views including HTML views, PDF and ePub downloads, according to the available data) and Abstracts Views on Vision4Press platform.
Data correspond to usage on the plateform after 2015. The current usage metrics is available 48-96 hours after online publication and is updated daily on week days.
Initial download of the metrics may take a while.