Fig. 4
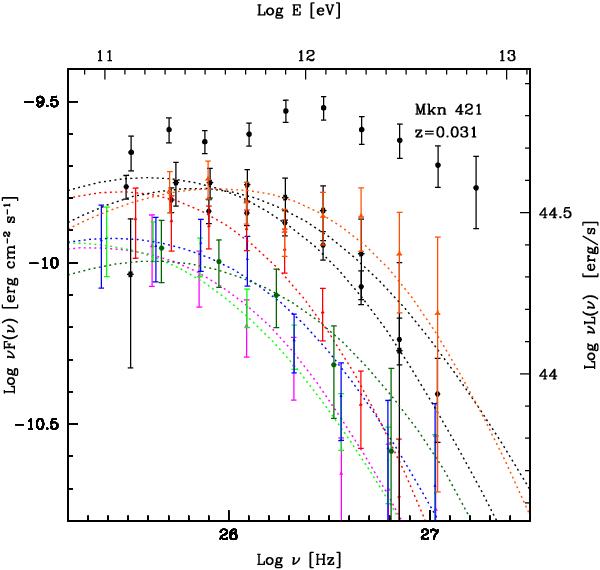
VHE SED of Mrk 421 derived from the MAGIC-I observations performed in the eight time slots with tightly simultaneous Swift/XRT data (see Sect. 4). The spectra are shown after correction of the EBL absorption, following Franceschini et al. (2008). For comparison, the spectrum derived from the observation that registered the highest flux (3.6 C.U. above 200 GeV) of the whole campaign, performed on 2008 March 30. For each night we also plot our model (see Sect. 4.1) to guide the eye.
Current usage metrics show cumulative count of Article Views (full-text article views including HTML views, PDF and ePub downloads, according to the available data) and Abstracts Views on Vision4Press platform.
Data correspond to usage on the plateform after 2015. The current usage metrics is available 48-96 hours after online publication and is updated daily on week days.
Initial download of the metrics may take a while.