Fig. 3
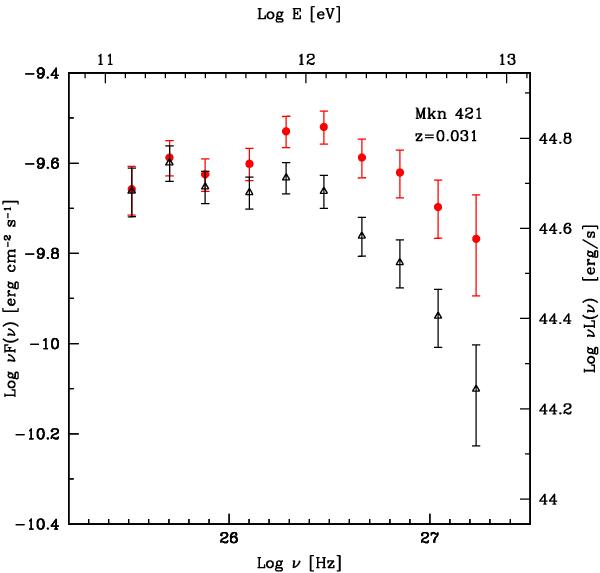
VHE SED of Mrk 421 derived from the MAGIC-I observations performed on 2008 March 30, when the flux rose to 3.6 Crab Units. Data points before (black open triangles) and after (red filled circles) applying a correction for EBL absorption following Franceschini et al. (2008) are shown. The observed position of the IC peak is evaluated at ~500 GeV from the fit with a curved power law, and above 1 TeV after deabsorption. This VHE spectrum was the hardest among the ones studied here, as illustrated in Fig. 4.
Current usage metrics show cumulative count of Article Views (full-text article views including HTML views, PDF and ePub downloads, according to the available data) and Abstracts Views on Vision4Press platform.
Data correspond to usage on the plateform after 2015. The current usage metrics is available 48-96 hours after online publication and is updated daily on week days.
Initial download of the metrics may take a while.