Free Access
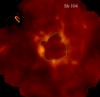
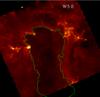
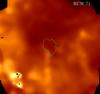
Fig. 6
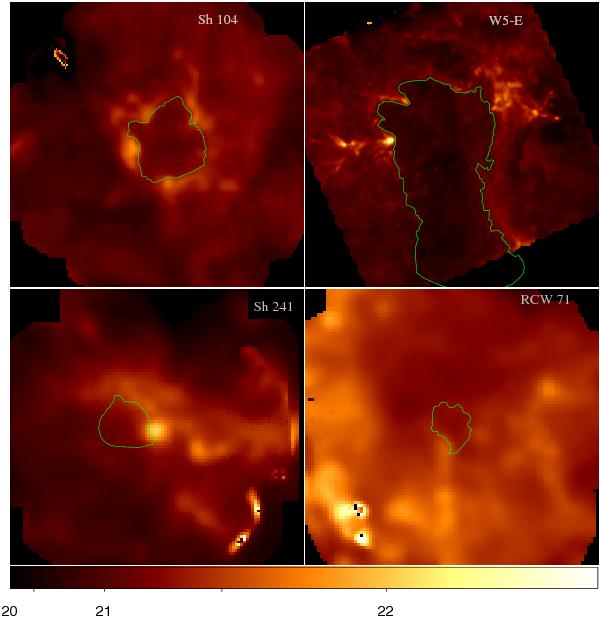
Column density maps created using Herschel 350 μm data and the temperatures shown in Fig. 4. The scaling for all panels is the same; the values range from 1020 cm-2 to 1022.5 cm-2. The green curves show the approximate extent of the bubble interiors. Enhancements are seen along the bubble PDRs.
This figure is made of several images, please see below:

Current usage metrics show cumulative count of Article Views (full-text article views including HTML views, PDF and ePub downloads, according to the available data) and Abstracts Views on Vision4Press platform.
Data correspond to usage on the plateform after 2015. The current usage metrics is available 48-96 hours after online publication and is updated daily on week days.
Initial download of the metrics may take a while.